
Welcome to TERRIL & CO.
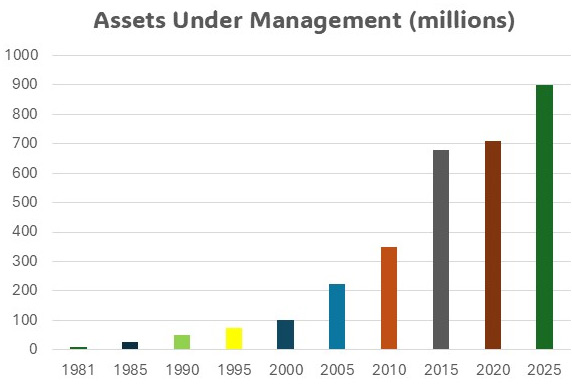
Terril & Company is an independent wealth management company founded in 1979 by John “Joe” Terril. Since then, referrals from satisfied clients and third-party professionals have fueled virtually 100% of its growth.
The company takes a highly personal approach to serving clients, which typically include high net worth individuals, trusts and private/corporate retirement plans.
Members of the Terril staff answer their own phones and truly offer close, personal service.
The investment selections Terril makes are based solely on their potential to produce positive, long-term returns for clients. The firm derives 100% of its revenue from client fees and 0% from commissions tied to the sale or purchase of securities.
Home ~ Philosophy
Philosophy
Fundamentals foremost; patient, often contrarian investing
Recognizing that “bandwagon” investing and playing momentum historically result in catastrophic losses, Terril & Co. searches for investments with characteristics or catalysts not fully appreciated by markets. As a long-term investor (usually three years or more) Terril will hold out-of-favor investments until positive change in their fundamentals becomes evident. While Terril hunts for unrecognized investment opportunities, it stows investor capital in liquid short-term investments to produce income and protect principal.
Terril & Co. believes that its willingness to make disciplined investing decisions apart from “the crowd” is central to its success. Why? Because many professional money managers chase performance and buy the ”hot” investment trends of the day.
Psychologically, it’s far easier for managers to buy the investments their peers are buying because being wrong with “the crowd” is more comfortable than being wrong while standing alone.
Many investors – professionals included – are apt to underestimate investment risk. In bull markets, they are eager to buy more of what is high in price.  They tend to manage to performance benchmarks and are more inclined to expand risk boundaries. In bear markets or with out-of-favor assets, their evaluations often fail to reflect the truism that many times, when an investment is low in price, significant financial risk is already eliminated.
Seeking 3X the reward for risk assumed
Terril & Co. seeks to manage risk by searching for investments with the minimum long-term potential to return three times the reward for the risk assumed.
It evaluates all forms of potential investments: equities and fixed income (domestic/foreign); preferred stocks (convertible/straight); commodities; exchange traded funds (ETFs); precious metals; MLPs and GPs of exchange-listed energy infrastructure trusts; real estate investment trusts (REITs); venture capital; and private placements.
Terril’s disciplined approach helps to remove emotion from investment decision-making. It tends to buy when the price reaches a favorable risk/reward threshold, which can lead Terril to being lightly exposed to markets that it believes are over-valued. The firm’s independence also frees it to take profits in successful investments when peers fear being underinvested.

Targeted annual return goal
Year to year, Terril & Co. seeks to generate 3% to 5% real growth (over and above inflation, taxes and fees) in client portfolios. Historically, wealth managers who consistently deliver investment returns in this range are rated in the top tier of investors.
Terril’s standard for acceptable investment return differs markedly from that of industry-driven money managers. In a year when the S&P 500 declines 21%, those managers are pleased to report a 17% loss to clients.

Fee scale reflects total return sensitivity
Conscientious cost control and an equitable fee structure help boost the net return to clients. Fees, calculated and billed quarterly, are entirely negotiable. Terril does not bill in advance. An advisory contract can be cancelled at any time without penalty.
The firm derives 100% of its revenue from client fees. It does not charge or accept any type of commission or other compensation for the sale or purchase of securities.
Fee scale
| Market value of managed assets | Annual fee as a percentage of managed assets |
|---|---|
| Up to $1 million | 1.0% |
| $1 million to $3 million | 0.75% |
| $3 million to $5 million | 0.6% |
| $5 million and above | 0.5% |
*Illustration: Presuming the negotiated fee to manage a $1 million portfolio is 0.75%, the cost to the client is $7,500 on an annual basis. If a client can earn 5% self-managing a portfolio, Terril & Co. needs to earn 5.75% to justify its involvement.

Home ~ Reports
Client Reports
Clients receive an easy-to-understand, two-page investment performance report every quarter. The report clearly presents eight key financial metrics.
- Current total value of assets in portfolio
- Current asset allocation (expressed as a percentage of total portfolio)
- Bond call/put information and maturities
- Accrued dividends and interest
- Deposits and withdrawals made during the quarter
- Portfolio gain or loss during the quarter (expressed in U.S. dollars)
- Five-year history of quarterly rates of return (deposits and withdrawals time-weighted)
- Annual rate of return (after four quarters)
If your performance report sparks a question, please call. Your call will be answered by one of our professionals who is eager to help.
Terril also welcomes client meetings to discuss investment performance and strategy.
To review a sample quarterly report, click here.
Sample
QUARTERLY REPORT
ABRAHAM LINCOLN FAMILY TRUST *
Quarter Ending December 31, 2024
Equities 29.4%
| 500 | 3M Company | 64,545 |
| 800 | Walt Disney Co. | 89,080 |
| 1,000 | Citigroup Inc. | 70,390 |
| 1,000 | Globus Medical, Inc | 82,710 |
| 1,500 | Solventum Corp. | 99,090 | 2,000 | Verizon Communications | 79,980 |
| 6,250 | Cleveland-Cliffs Inc. | 58,750 |
TAXABLE BONDS 31.10%
| 100 | US Bancorp Series A Pfd FLT 5.93751% | 85,244 |
| 5,000 | Aberdeen Asia-Pacific Income Fd. Inc. | 73,600 |
| 50,000 | Plains All American FLT 8.89507% | 50,000 |
| 90,000 | Olin Corp. 5.125% 9/15/2027 | 88,200 |
| 100,000 | Comerica Preferred Reset 5.625% | 99,625 |
| 100,000 | Int' Lease Fin FLT 6.29% 12/21/2065 | 82,500 |
| 100,000 | Keycorp Capital I FRN 5.59496% 7/1/2028 | 97,000 |
Other 6.54%
| 500 | SPDR Gold Trust | 121,065 |
Cash Equivalents 32.96%
| Central Tst & Inv. Money Market Fd | 135,498 | |
| 4,000 | Wesco Pfd 10.625% 6/22/2025 | 102,080 |
| 115,000 | Ally Financial 5.75% 11/20/2025 | 115,575 |
| 120,000 | Cox Entertainment 7.625% 6/15/2025 | 121,021 |
| 125,000 | Laboratory Corporation of America 3.6% 2/1/2025 | 124,800 |
| Accrued Dividends | 2,343 | |
| Accrued Interest Earned | 9,323 |
| CURRENT TOTAL | $1,852,418 |
|---|
Five Year Performance
REVIEW BY QUARTERS**
Abraham Lincoln Family Trust ^
December 31, 2024
| Quarter Ending: | 2020 | 2021 | 2022 | 2023 | 2024 |
|---|---|---|---|---|---|
| March | -23.25% * | 9.59% * | 6.26% * | 1.95% * | 5.93% * |
| June | 12.48% * | 3.03% * | -6.10%* | 0.35% * | 0.91% * |
| September | 3.45% * | -2.32% * | -4.06% * | 0.61% * | 3.99% * |
| December | 11.26% * | 3.21% * | 3.34% * | 7.14% * | 0.24% * |
| Annual | -0.64% * | 13.83% * | -1.08% * | 10.28% * | 11.43% * |
First performance reported March 31, 1988.
* Taxable Equivalent
| 2019 | 17.46% * | 2014 | 6% * | 2009 | 23.55% * | 2004 | 2.41% * | 1999 | 0.56%* | 1994 | 0.36%* | 1989 | 16.36% |
|---|---|---|---|---|---|---|---|---|---|---|---|---|---|
| 2018 | -11.51% * | 2013 | 13.45% * | 2008 | -1.42% * | 2003 | 15.11% * | 1998 | -1.65% * | 1993 | 4.08% * | 1988 | 5.05% * |
| 2017 | 9.44% * | 2012 | 10.91% * | 2007 | 5.65% * | 2002 | 3.21% * | 1997 | 13.76%* | 1992 | 9.93%* | ||
| 2016 | 8.71% * | 2011 | -1.19% * | 2006 | 9.33% * | 2001 | 8.56% * | 1996 | 7.02%* | 1991 | 20.55%* | ||
| 2015 | -6.4% * | 2010 | 17.06% * | 2005 | 1.56% * | 2000 | 23.88% * | 1995 | 13.90% * | 1990 | 8.04%* |
^ Abraham Lincoln Family Trust is a fictitious name to protect the confidentiality of an actual client.
| ** The above performance are the actual results of a $5-$10 million retirement plan under our management, is net of any fees and includes reinvestment of earnings and is managed with a balanced investment objective; results were achieved with the following asset ranges: Equities 0-50%; Fixed Income 15-95%; Cash Equivalents 0-80%; and Other 0-10%. We believe the above to be indicative of our average historical results. However, such results are not guaranteed. Future results may be materially different. It is possible for accounts to lose money. |
Home ~ St. Louis
St. Louis Office


Home ~ Springfield
Springfield Office


Home ~ Market Outlook
Market Outlook
Video Blog: Current Thoughts on the Economy
Written Blog: Thoughts on the Economy
Friday, January 2, 2026
Happy New Year! Another year in the history books...
Before we discuss our thoughts on the New Year, some observations on 2025: The world economy stayed stronger than most expected. Inflation eased but not to the extent that many had predicted. Inflation continues to be sticky at 2.75%-3.00% in the United States. Inflation is also stubbornly high in Japan and other industrial countries. Short-term interest rates fell; however, long-term rates remain in the 4.125% area. Stock prices continued to be extremely volatile. By year-end, returns were positive by approximately 15% depending on the exposure to Artificial Intelligence (AI) tech stocks. Our portfolios in 2025 performed comparably well with approximately 33% in stocks and the balance in much safer income investments.
For the new year we are cautious. Almost every prediction is for a stronger economy, higher corporate earnings, lower interest rates and higher stock prices. The consensus is rarely correct. We agree that the world economy should remain in growth mode. However, we believe inflation will stay in this 3% area. This should keep the United States’ 10-year interest rate at current levels or higher. This rate determines mortgage rates, car loan rates and others. The Federal Reserve Bank will lower the short-term interest rate several times in 2026 as they control this interest rate. The markets control the longer-term interest rate and as stated we expect this rate to move slightly higher. Stock valuations are historically high based upon their multiple earnings, cash flows, book value, etc. By 2026 year-end, we expect more modest gains in stocks and much more volatility, especially in the high-flying Artificial Intelligence (AI) technology sector.
We appreciate your continued trust and confidence. Best wishes for a healthy and prosperous 2026.
Home ~ Govt/Regs
Govt/Regulatory
Client Security/Privacy
Terril applies physical, electronic and procedural safeguards that meet industry standards for client security. It does not warehouse sensitive data (such as social security numbers) in its firewall-protected computer network. Its office is video-monitored 24/7.
All client communication, including your name, contact information and questions, is kept strictly confidential and made available only on a “need to know” basis to members of our staff. Click here to read our privacy policy.
Registered with SEC
“Terril and Company” is the operating name for Terril Brothers, Inc., an SEC registered investment advisor and a corporation wholly owned by John “Joe” Terril. Click here to view a copy of the firms SEC registration. “Click here to read Form CRS”. If you would like a paper copy of the firm’s registration statement, please call.
Home ~ Contact
Contact Us